

Understanding QX Trading Explained
📊 Explore QX trading: key features, platforms, risks & benefits explained. Understand its role in financial markets for smarter investing decisions in India.
Edited By
Amelia Shaw
In trading and investing, ATH stands for All-Time High. This term refers to the highest price level a stock, commodity, or any financial instrument has ever reached since it began trading. For instance, if Reliance Industries shares hit ₹3,000 for the first time ever, that price point marks its ATH.
Understanding ATH is crucial because it often signals strong market interest and momentum in that asset. Traders watch ATH levels closely as they reflect bullish sentiment and can offer clues about the future price direction. However, hitting an ATH doesn't always mean the asset will keep rising—it might also lead to a pullback or correction.

All-Time High points act like psychological barriers. Breaking one can boost trader confidence, but it might also trigger profit-booking if investors feel the price has run too far, too fast.
Here’s what makes ATH significant:
Market Sentiment Gauge: ATH usually suggests buyers are optimistic, pushing prices to record levels.
Resistance and Breakout Identification: A previous ATH can become a resistance level, where prices struggle to go above. Clearing this resistance might signal a fresh upward trend.
Investment Decision Tool: Investors may decide to enter or exit positions based on whether an asset is near or breaking its ATH.
For example, during the Diwali festive season, many Indian traders look for stocks at ATHs, expecting continued demand driven by positive market sentiment. But chasing these highs without solid analysis can be risky, leading to losses if the asset price corrects.
Indian investors should also consider factors like broader market indices (Sensex or Nifty), company fundamentals, and sector performance when assessing ATH signals. Using stop-loss orders and diversifying investments can help manage risks involved with trading assets near their all-time highs.
The takeaway: ATH is a valuable tool but best used alongside other indicators and caution, especially in volatile markets like equities, commodities, or cryptocurrencies.
Understanding ATH — All-Time High — is essential for anyone trading stocks or cryptocurrencies. It marks the highest price level an asset has ever reached since it came into existence or got listed on an exchange. Recognising ATH can help traders spot strong momentum and market sentiment shifts, which often influence their buy or sell decisions.
An All-Time High (ATH) is the peak price at which a stock or any tradable asset has ever traded historically. For example, if Reliance Industries shares have never gone above ₹2,600, then ₹2,600 is their ATH. When the price hits this level again or surpasses it, it suggests the asset is at or breaking a new record.
This is useful because an ATH is a clear indicator of bullish sentiment and potential strength in the market. Many traders pay attention to ATH since prices reaching these levels can attract buyers expecting continued upward momentum. However, it also demands caution as prices near ATH can sometimes trigger profit booking.
Distinctly, an ATH is not the same as an intraday high, which is the highest price an asset hits during a single trading session. For instance, a stock might touch ₹2,580 during the day but close at ₹2,550. Even if ₹2,580 is higher than previous days, if it has never crossed ₹2,600 historically, the ATH remains ₹2,600.
Intraday highs are more short-lived and indicate temporary price action, whereas ATH reflects a significant historical milestone. Traders use this difference to gauge whether a price move is a brief spike or part of a larger trend.
In Indian stock markets like the National Stock Exchange (NSE) and Bombay Stock Exchange (BSE), ATHs are widely tracked. For example, Infosys reaching a new ATH on NSE signals strong buying interest and may influence institutional investors. Similarly, sector-specific ATHs, like those in pharma or banking, help guide portfolio choices.
Tracking ATH in Indian markets is especially helpful during volatile times—ask any trader how significant Tata Motors hitting a new ATH is amid market movements.
In cryptocurrency trading, ATH carries even more weight because crypto markets are notoriously volatile. Bitcoin setting new ATHs often generates media buzz and influences market participation worldwide, including India. Investors see an ATH in cryptocurrencies as a strong signal of market confidence, though it can also lead to frenzy-driven price swings.

Given the 24/7 nature of crypto markets, ATHs serve as important psychological markers. Platforms like WazirX and CoinDCX prominently display ATHs to guide traders navigating these fast-moving assets.
Understanding where an asset stands in relation to its ATH provides traders with valuable insight into market trends and potential price behaviour. It is one of the foundational concepts every trader or investor should grasp before formulating strategies based on price movements.
Reaching an All-Time High (ATH) is a significant event for investors and traders because it reflects a stock or asset hitting its highest price ever. This can influence market behaviour and decision-making in real time. When a stock listed on NSE or BSE hits an ATH, it often signals strong demand or positive sentiment, making many traders take notice for potential opportunities or risks.
Hitting an ATH can boost trader confidence dramatically. It often convinces investors that the market or a particular stock is performing well and may continue to rise. For instance, if Reliance Industries reaches its peak price historically, traders may perceive it as a sign of strength, encouraging more buying.
On the flip side, the fear of missing out (FOMO) kicks in when traders see others profiting from an ATH, pushing them to jump into the trade hastily. This behaviour can cause sharp price rises, followed by sudden corrections when the excitement fades. Indian traders need to be cautious not to let FOMO cloud their judgment; understanding when to ride the momentum and when to hold back can save losses.
ATH levels often act as resistance points in technical analysis. When a stock price hits its ATH, it struggles to go beyond that point because many investors might book profits, leading to a temporary price stall or pullback. For example, if Tata Motors reaches an ATH and stalls, traders might see this as a cue to sell or wait for a confirmed breakout.
Once the price breaks through the ATH convincingly with good volume, that level can turn into support. Meaning if the price drops later, it may find a floor near the previous ATH, attracting buyers again.
ATHs also play a key role in chart patterns. Traders use them to identify trends and predict future price movements. For instance, a breakout above ATH combined with high Relative Strength Index (RSI) can signal strong bullish momentum. Conversely, if prices approach an ATH but RSI shows overbought conditions, it might warn of a potential pullback.
For Indian traders and investors, watching ATH levels alongside other technical tools can help spot entry and exit points more effectively, balancing risks and rewards.
Understanding why ATH matters empowers you to use it smartly rather than reacting emotionally to market noise.
Using ATH data smartly can improve your trading by helping to time entries and exits more effectively. An asset hitting its all-time high often signals strong momentum, but relying on ATH alone can be risky. Combining it with other market signals leads to better decisions.
Buying near ATH vs waiting for breakout confirmation: Buying close to an ATH can be tempting as it suggests optimism, but it's wise to wait for breakout confirmation. For example, if a stock listed on NSE breaches its previous high with substantial volume, it may indicate the start of a strong uptrend. On the other hand, entering before a confirmed breakout risks catching a false signal, causing losses if the price reverses.
Selling or booking profits at ATH: Investors often consider booking profits when their holdings reach ATH. For instance, if a mid-cap stock hits a new peak, some traders may sell part of their stake to lock gains, especially if indicators suggest overbought conditions. However, selling too early can mean missing out on further upside. Balancing profit booking with market signals is necessary.
Volume analysis at ATH: Volume plays a key role in validating an ATH breakout. A fresh ATH accompanied by high trading volume typically shows genuine buyer interest. Suppose a stock on BSE hits a new high but with low volume; this could imply weak demand, increasing the chance of a price pullback. Monitoring volume helps distinguish strong breakouts from misleading price spikes.
Relative Strength Index (RSI) and ATH: RSI measures momentum and can confirm if a stock is overbought near its ATH. An RSI above 70 signals overbought conditions, warning of a potential pullback. For example, in crypto trading, an ATH with a high RSI may prompt traders to wait rather than enter immediately. Using RSI with ATH aids in spotting when buying pressure may fade.
Timing trades around ATH levels is about understanding the mix of price, volume, and momentum indicators. This approach helps reduce the risks linked with blindly chasing new highs.
In summary, applying ATH information alongside volume and RSI can give Indian traders a clearer picture. It helps spot when to enter after a confirmed breakout or when to book profits to avoid reversals. This combination supports more informed, practical trading strategies in both stock and crypto markets.
Trading based on All-Time High (ATH) price levels involves its own set of risks and challenges that every trader and investor needs to understand clearly. While ATHs can signal strong momentum, relying solely on such levels without caution can lead to significant losses. Recognising these dangers helps you make more informed decisions and protect your investments.
Potential for price reversals and corrections: When a stock or asset hits an ATH, it often attracts buyers keen to ride the wave of rising prices. However, this enthusiasm can be short-lived if the market decides the price is too high. Price reversals or sharp corrections tend to follow momentum-driven rallies, which means chasing the price when it has already peaked might leave you holding an overvalued asset. For example, during the 2020 surge in certain tech stocks in India, some retail investors jumped in as prices were climbing to ATHs, only to face sudden corrections a few days later.
Overvaluation concerns: An ATH does not always reflect the fundamental value of the company or asset. Sometimes, prices push higher due to hype, speculative trading, or temporary market conditions rather than solid financials. This overvaluation can result in unsustainable price levels. Indian traders selling at these points without checking company fundamentals risk losses when the market realigns prices closer to intrinsic values, often triggered by earnings reports or sector downturns.
Volatile markets versus stable trends: The significance of ATHs fluctuates with the broader market mood. In highly volatile markets — often driven by geopolitical tensions or sudden policy shifts — ATHs might not indicate a stable uptrend but a short-term spike. For instance, a stock hitting an ATH amidst sudden positive news can quickly lose ground as sentiment changes. Conversely, in stable bull markets, ATHs tend to be stronger signals of sustained growth, making them more reliable for strategic trading.
Impact of economic news and policy changes: Economic indicators and government policies heavily influence how ATHs behave. Announcements from the Reserve Bank of India (RBI) regarding interest rate decisions or changes in Foreign Direct Investment (FDI) norms can sharply impact prices. An ATH reached just before such announcements may not hold as traders reassess risks. Staying updated on policy news helps you judge whether an ATH is likely to sustain or face immediate pressure.
Understanding these risks around ATH helps traders avoid pitfalls like chasing overvalued prices or ignoring market signals. Combining ATH analysis with broader market insights and fundamental research provides a balanced approach to trading decisions.
Key takeaway: Always treat ATHs as just one piece of the puzzle. Consider market volatility, economic news, and company fundamentals before making your move at or near these price points.
Trading stocks at their all-time high (ATH) requires a careful approach, especially in the dynamic Indian markets. Practical tips help traders avoid common pitfalls and make informed decisions. These pointers combine technical understanding with real-world market factors, offering a balanced strategy to manage gains and risks effectively.
Checking company fundamentals and sector trends is essential before investing in any stock nearing or hitting an ATH. A stock reaching its ATH might look attractive because of its recent climb, but it’s crucial to look beyond the price chart. Assessing the company’s earnings growth, debt levels, and cash flow gives insight into whether the rise is supported by solid business prospects. For example, if a FMCG company listed on NSE shows steady revenue growth supported by expanding rural markets, its ATH is more likely backed by fundamentals. Also, understanding sector trends matters. If the IT sector is booming due to increased digital adoption, an IT stock hitting ATH could ride the wave sustainably. Ignoring these factors may lead you to buy into temporary hype rather than lasting strength.
Monitoring regulatory announcements from SEBI and RBI is another vital step. Indian regulators frequently issue guidelines that influence market behaviour. For instance, SEBI’s rules on margin requirements or RBI’s stance on interest rates can impact liquidity and sentiment. If SEBI tightens margin rules, volatile stocks at ATH might see price corrections as traders adjust positions. Similarly, RBI’s policy announcements often cause swings in banking and finance stocks. Staying updated on such regulatory measures helps traders anticipate market reactions and manage their exposure accordingly.
Setting stop-loss orders near ATH levels can help protect profits and limit losses. When a stock approaches or crosses its ATH, the price might quickly reverse as some investors book gains. By placing a stop-loss just below the recent ATH, you set an automatic exit point that prevents deep losses if the price falls sharply. For example, if a stock hits ₹1,500 as its ATH, a stop-loss at around ₹1,450 may safeguard your investment while allowing some breathing space for minor fluctuations. It’s a practical risk management tool especially for active traders in fast-moving markets.
Spreading investments across stocks and asset classes reduces reliance on individual stock performance, which is particularly important when chasing ATH stocks. Overconcentration in a few high-flying stocks increases risk if those prices correct suddenly. By diversifying into other sectors or assets like bonds, gold, or mutual funds, you balance your portfolio’s risk and reward. Take a trader who allocates ₹5 lakh across technology, pharmaceuticals, and consumer goods stocks along with a portion in government bonds. This approach cushions losses when one sector underperforms while still allowing participation in growth from ATH stocks.
Practical trading near ATH demands more than bullish enthusiasm; it involves thorough research, regulatory awareness, disciplined risk control, and balanced investing. Following these tips can help Indian traders navigate volatile price peaks with confidence and care.
📊 Explore QX trading: key features, platforms, risks & benefits explained. Understand its role in financial markets for smarter investing decisions in India.

Explore Quotex India 🇮🇳 in detail: platform features, easy registration, trading choices, payment methods, and legal tips for safe, smart trading online 📊
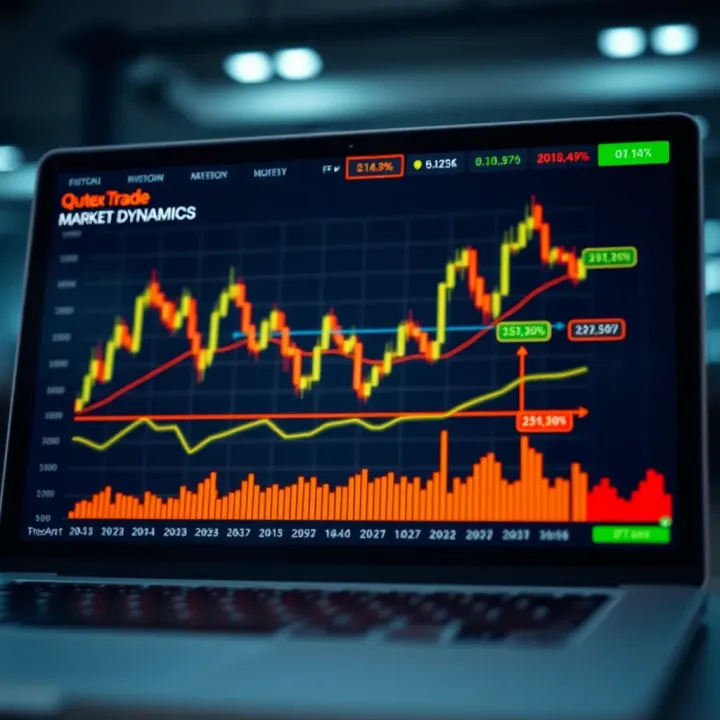
Explore Qutex trade in detail 📊 Learn how it works, benefits, risks, and get expert tips to trade confidently in India's market landscape 🇮🇳

Explore Qutoex in depth 💡 Understand its features, functionalities, and practical uses, plus get answers to common queries for smarter decisions! 📊
Based on 11 reviews