

How to Use Quotex Trading Signals Effectively
Explore Quotex signal online services 📈 Learn how to use trading signals effectively, manage risks, and boost your trading success in India 🇮🇳 today!
Edited By
Sophie Bennett
Fibonacci tools have become a popular choice among traders for spotting potential price levels in financial markets. These tools rely on specific ratios derived from the Fibonacci sequence—a series of numbers where each number is the sum of the two before it. Though it may look like math wizardry, the real-world application is straightforward and practical for trading decisions.
Key Fibonacci ratios such as 38.2%, 50%, and 61.8% are used to predict where price pullbacks (or retracements) might reverse or continue. For example, if a stock rises from ₹1,000 to ₹1,200, traders often look at 38.2% or 61.8% retracement levels between these prices to identify where the price might find support or resistance.

These retracement levels are drawn on price charts to highlight zones where the market may change direction. Traders use them to enter or exit positions, place stop-loss orders, or set target levels during trends. On top of retracements, Fibonacci extensions predict potential price moves beyond previous highs or lows. In essence, extensions help estimate how far a trend could go once a breakout starts.
Understanding and applying Fibonacci tools helps traders make informed decisions rather than guessing about market movements. It doesn’t guarantee success but provides a structured approach to identify turning points based on historic price action.
Common practical tips include:
Use Fibonacci retracements on significant swings, typically from a recent high to low or vice versa.
Combine these signals with other technical tools like moving averages or volume for confirmation.
Avoid relying solely on Fibonacci levels; treat them as part of a broader trading strategy.
By mastering how to read and apply these ratios to real trading charts, you gain an effective toolset for better timing your trades in dynamic markets. This guide aims to clarify the essential concepts so you can apply Fibonacci analysis effectively, keeping in mind its limitations and strengths in your trading routine.
Understanding the basics of Fibonacci in trading is essential for anyone looking to add precision to their market analysis. These tools help traders identify potential price reversal points or continuation zones with more confidence. Rather than guessing, traders use Fibonacci ratios to mark critical levels on charts, guiding decisions on entry, exit, and stop-loss placements. This section lays the foundation by explaining where Fibonacci numbers come from and why they show up repeatedly in market price movements.
The Fibonacci sequence began with Leonardo Fibonacci, an Italian mathematician from the 13th century. Originally used to illustrate population growth in rabbits, this simple series of numbers—where each number is the sum of the two preceding ones—has since found its way into nature, art, and financial markets. For instance, the spiral patterns in sunflower heads or pine cones follow Fibonacci ratios, showing these numbers represent natural growth patterns.
In trading, what's relevant are the ratios derived from this sequence, not the sequence itself. For example, dividing a number in the sequence by the one that follows it approximates 0.618 (or 61.8%), known as the "golden ratio." Its complementary ratio, 38.2%, and 23.6%—derived from related calculations—serve as key retracement levels. Traders watch these Fibonacci ratios closely to estimate how far a price could pull back before resuming its original trend.
Price movements in financial markets tend to follow certain natural rhythms, reflecting human behaviour and underlying economic forces. These rhythms often align roughly with Fibonacci ratios, enabling traders to predict pullbacks and extensions more effectively. For example, if a stock climbs sharply, it often retraces by around 38.2% or 61.8% before moving higher again. These levels act like invisible barriers where supply and demand battle out.
Trader psychology plays a big role here. Many market participants monitor Fibonacci levels, creating self-fulfilling prophecies: when enough traders expect support at a 61.8% retracement, they tend to place buy orders, causing price to bounce. Likewise, resistance can appear near these zones as sellers step in. Understanding this helps traders anticipate where price might stall or reverse, improving timing and risk management.
Key takeaway: Fibonacci tools provide a concrete method to read natural market patterns and collective trader behaviour, which is why mastering them forms a solid base for any trading strategy.
Fibonacci retracement is a straightforward yet powerful tool that traders use to spot potential reversal levels after a strong price move. It helps identify where a market might pause or bounce back before continuing in the original direction. This technique works because many traders and algorithms watch these levels, making them self-fulfilling to some extent. For example, if you see the Nifty 50 index rallying sharply and then pulling back, drawing retracement levels can show where buyers might step back in.
To start drawing Fibonacci retracements, you need to mark significant swing highs and lows on your price chart. A swing high is a clear local peak where the price reached before reversing down, while a swing low is a sharp drop point before the market bounced back. These points should be prominent and recent enough to reflect the current market sentiment. For instance, while analysing Reliance Industries' stock, you might choose the high and low of a recent uptrend to draw retracement lines.
Picking the right swings is crucial because if you take minor or noisy price points, retracement levels won’t reflect meaningful support or resistance. Traders often look at daily or weekly charts for clearer swings, avoiding short-term noise on intraday charts.
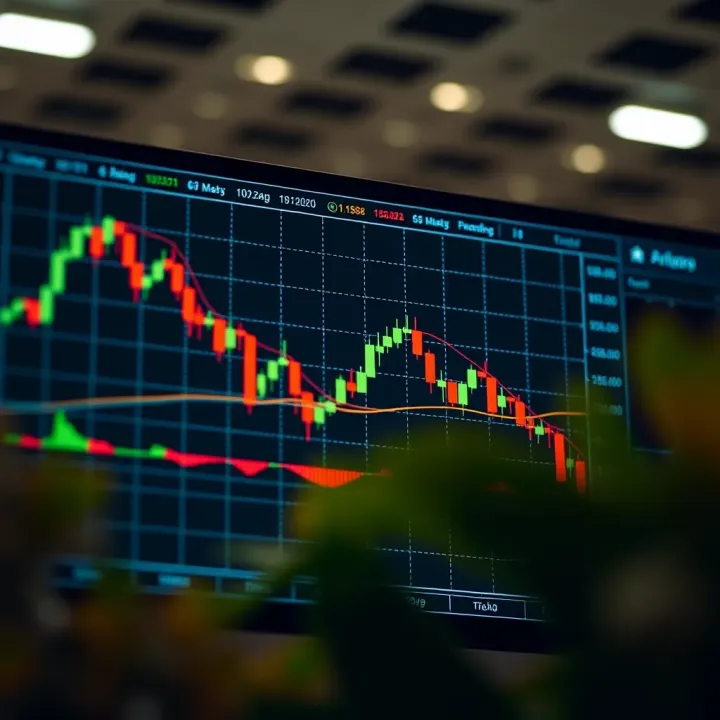
The most popular Fibonacci retracement levels are 23.6%, 38.2%, 50%, 61.8%, and sometimes 76.4%. These percentages represent how far the price has retraced from the prior move. Among these, 38.2%, 50%, and 61.8% are watched most closely by traders.
For example, after a strong uptrend in TCS shares, a pullback to the 61.8% retracement level could act as a firm support zone where buyers may re-enter the market. It's worth noting that the 50% level is not a Fibonacci number but remains popular because financial markets often retrace half the previous move before continuing.
Fibonacci retracement lines essentially act as potential support and resistance zones in the market. When prices approach any of these levels, market participants often behave cautiously. A trader might place a buy order near a 38.2% retracement during an uptrend, expecting the pullback to end and the price to bounce.
Conversely, if the price breaks below these levels decisively, it could indicate a stronger reversal, prompting traders to exit or adjust their stops. For instance, in a corrective phase for HDFC Bank, the 50% Fibonacci level often coincides with price congestion and can help set well-timed stops or targets.
Relying solely on Fibonacci retracements can be risky since these levels are watched broadly and can sometimes produce false signals. That's why combining Fibonacci levels with other technical tools improves reliability. Momentum indicators like RSI or MACD can confirm if the price is likely to reverse near a retracement.
Moving averages also complement Fibonacci zones well. For example, if a 61.8% retracement coincides with the 200-day moving average, that area forms a stronger support level. Volume analysis adds another layer: increasing volumes near retracement levels often validate buyer interest.
Using Fibonacci retracements alongside other tools doesn’t just enhance your entries and exits; it also sharpens risk management by reducing fake signals. Always look for convergence of signals before making trading decisions.
Fibonacci extensions help traders identify levels beyond the current price range where the price might move after a retracement. Unlike retracements, which focus on potential reversal points within the existing trend, extensions forecast where the price could extend following the continuation of the trend. This distinction is vital for planning profit targets and exit points, especially in trending markets.
Retracements measure how deeply a price has pulled back from a preceding trend move, typically between key swing highs and lows. Extensions, on the other hand, forecast potential price targets ahead based on the magnitude of the prior move. Practically, retracements answer 'where could the price pull back to?', while extensions help answer, 'after the pullback, how far could the trend resume?'.
Common extension levels include 127.2%, 161.8%, and 261.8% of the initial price move. These ratios relate to key Fibonacci numbers and often act as psychological price barriers where traders expect resistance or support. For example, if a stock moves from ₹1,000 to ₹1,200 and then retraces to ₹1,150, projecting an extension to 161.8% would estimate a target around ₹1,335.
Extensions serve as convenient reference points for setting price targets. Traders often place take-profit orders near these levels because the market may struggle to move significantly beyond them without a pause or reversal. This works well in intraday or swing trading, where identifying realistic targets improves trade discipline.
Using extension levels also aids risk management. When traders know the next likely area of resistance or support, they can adjust stop-loss orders accordingly. For example, a trader entering near the 61.8% retracement level might set a stop-loss slightly below it and target the 161.8% extension for profits. This ensures favourable risk-reward ratios and prevents overexposure to potential reversals near key Fibonacci extensions.
Fibonacci extensions provide a calculated way to anticipate future price action beyond pullbacks, making them essential tools for strategic exits and risk control.
In practice, combining Fibonacci extensions with volume spikes or momentum indicators like RSI (Relative Strength Index) can improve confidence in target levels. As always, extensions should be part of a broader strategy that includes market context and other technical signals to avoid being misled by false breakouts or sudden trend shifts.
Integrating Fibonacci tools with other trading methods improves the reliability of market analysis and trading decisions. While Fibonacci levels provide key price zones for potential support and resistance, combining them with trend analysis, volume, and momentum indicators offers a clearer picture of market sentiment and price direction. This blend helps traders avoid false signals and better time their entries and exits.
Using moving averages alongside Fibonacci retracements or extensions helps confirm the prevailing market trend. For instance, if a stock retraces to its 61.8% Fibonacci level and also finds support near its 50-day moving average, it strengthens the likelihood of a bounce. This setup reassures the trader that the underlying trend remains intact, improving confidence in taking a trade at this level.
Trend lines add another layer to Fibonacci analysis by highlighting points where price action aligns with both trend direction and Fibonacci zones. Such confluence areas can act as stronger support or resistance. For example, a rising trend line intersecting a 38.2% Fibonacci retracement level often becomes a critical area for traders to watch, since it signals an overlap of technical factors. Trades based on confluence tend to have better risk to reward.
Volume acts as a confirmation tool for Fibonacci levels. When price approaches a key Fibonacci retracement or extension level accompanied by rising volume, it indicates traders’ genuine interest. For instance, if the price hits a 50% retracement with above-average volume, the level is likely being respected, making it a stronger signal than a retracement on low volume.
Momentum oscillators like the Relative Strength Index (RSI) or Moving Average Convergence Divergence (MACD) can add precision to Fibonacci zone trading. When price reaches a Fibonacci level and the RSI shows oversold conditions in an uptrend, it suggests a potential reversal. Conversely, an overbought reading near a Fibonacci extension may warn of a possible correction. Using momentum with Fibonacci helps traders avoid catching falling knives or entering prematurely.
The key benefit of combining Fibonacci tools with trend, volume, and momentum indicators lies in building a multi-dimensional view of the market. Such confirmation reduces guesswork and improves trade accuracy.
Integrating multiple techniques ensures that Fibonacci signals are not taken in isolation but within the broader context of market dynamics. Traders who master this approach can identify high-probability trades with better risk management, ultimately leading to more consistent results.
Using Fibonacci tools can certainly aid trading decisions, but understanding their limitations is just as important. Traders who ignore potential weaknesses risk false confidence in their analysis, which can lead to losses. This section highlights key pitfalls and practical considerations to keep in mind when applying Fibonacci methods.
Fibonacci retracements and extensions depend heavily on the trader’s choice of swing highs and lows. The starting and ending points can vary between charts or traders, causing different Fibonacci levels to appear. For example, on a daily chart, one trader might select the low of ₹1,200 and the high of ₹1,500, while another chooses slightly shifted points at ₹1,180 and ₹1,520. This difference can shift key levels and affect trade decisions. Therefore, it's crucial to test multiple drawing points to find levels that align best with price action.
Relying solely on Fibonacci levels can be risky because these tools do not guarantee price reversals or continuations. Markets move on various factors like news, economic data, and investor sentiment that Fibonacci ratios alone cannot predict. For instance, the Nifty 50 index may find a support at the 61.8% retracement, but a sudden policy change might invalidate that level.
Traders must treat Fibonacci levels as one part of the toolkit rather than a standalone strategy. The danger in over-reliance is that it may wrongly signal trades ignoring other vital market cues.
Fibonacci levels work best alongside other technical indicators. Combining them with moving averages, volume trends, or momentum oscillators like RSI can help confirm whether a Fibonacci level will hold. For instance, if the price hits a 50% retracement level while the Relative Strength Index (RSI) indicates oversold conditions, that confluence suggests stronger support.
This multi-tool approach reduces the chance of false signals, encouraging better trade accuracy. Indian markets, known for volatility, particularly benefit from such confirmation.
Even with sound confirmation, no method is foolproof. Stop-loss orders must be placed strategically, often slightly beyond Fibonacci levels, to manage unexpected moves. For example, if buying near an 38.2% retracement level in a mid-cap stock, placing a stop-loss a few points below this level limits risk if the support fails.
Additionally, position sizing should reflect the uncertainty around Fibonacci predictions. Traders should avoid overexposure, especially in fast-moving markets where price may break through multiple Fibonacci levels in a short time.
While Fibonacci tools provide useful insights, treating them with caution and combining them with risk management and other analysis methods ensures they remain effective and practical in real-world trading.
In summary, appreciating the subjective nature of Fibonacci drawings and confirming signals through additional tools can safeguard you against common pitfalls. A disciplined approach to risk management keeps losses in check when the market defies Fibonacci expectations.
Explore Quotex signal online services 📈 Learn how to use trading signals effectively, manage risks, and boost your trading success in India 🇮🇳 today!
📊 Learn to spot and use the diamond pattern in trading for better market trend reversal predictions. Avoid common errors and boost your trading skills effectively.

📊 Explore QX trading: key features, platforms, risks & benefits explained. Understand its role in financial markets for smarter investing decisions in India.

📊 Master Quotex trading with clear strategies, risk tips, and PDF guides tailored for Indian traders aiming to boost success in the market. 📈
Based on 12 reviews