
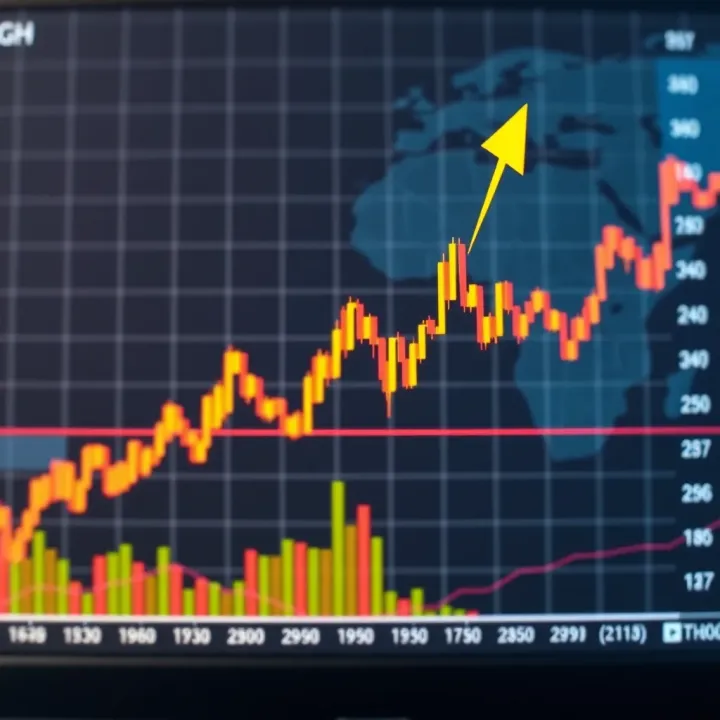
Understanding ATH Meaning in Trading
📈 Learn what ATH (All-Time High) means in trading, how it shapes market trends, and smart strategies Indian investors can use to manage risks and spot opportunities wisely.
Edited By
Emily Shaw
The term All-Time High (ATH) in trading refers to the highest price ever reached by a financial instrument—be it a stock, commodity, index, or crypto—since it began trading. It represents the peak value recorded on the market, reflecting the maximum enthusiasm or demand from investors and traders at that moment.
Identifying an ATH is straightforward: if a stock of Reliance Industries hits ₹2,600 for the first time and never crossed this price earlier, that level becomes its ATH. Importantly, ATHs do not reset unless the instrument trades beyond that historic peak.

An ATH is more than just a number; it signals strong market sentiment and often acts as a psychological barrier or support level in future price movements.
Understanding ATHs helps traders capture momentum trends and gauge potential breakout or reversal points. For instance, a stock consistently testing its ATH might indicate bullish strength, enticing traders to buy expecting further rises. However, it could also signal overvaluation, prompting cautious investors to take profits.
ATHs occur not only in equities but also in indices like the Nifty 50 or Sensex. When these indexes reach new ATHs, it typically reflects broader economic confidence or positive macro events in India’s financial markets.
In commodities, like gold or crude oil, ATH points to prevailing supply-demand dynamics, geopolitical factors, or seasonal trends. Traders watch these benchmarks closely to time their entry or exit strategies.
By tracking ATHs, investors can:
Spot momentum: Sustained trading near ATH often attracts momentum traders seeking quick gains.
Set targets: ATHs serve as logical price targets or resistance levels.
Manage risk: Knowing the ATH helps in placing stop-loss orders effectively.
While ATH readings are valuable, relying on them alone can be risky. Prices hitting an ATH might soon face profit booking or market corrections. Therefore, combining ATH observation with other technical and fundamental tools creates a more balanced trading approach.
In the following sections, we will explore how to interpret ATHs in different markets, their impact on trader psychology, and practical strategies for trading effectively around these key price points.
The term All-Time High (ATH) refers to the highest price level that a financial asset has ever reached on record. In trading, recognising an ATH is essential because it often signals significant investor interest and momentum in that asset. For example, when a stock listed on the National Stock Exchange (NSE) hits its ATH, it means that its price is at the peak compared to its entire trading history. This can attract more buyers who expect continued growth or caution from sellers anticipating a pullback.
Understanding ATH helps traders and investors gauge the strength of market trends and identify critical price points for decision-making. It differs from other benchmarks like the 52-week high, which only covers the past year, whereas ATH covers the entire available historical timeframe. Thus, an ATH represents a broader context, highlighting the ultimate price ceiling an asset has hit so far.
ATH is the maximum price attained by a particular asset, such as a stock, commodity, or cryptocurrency, since it started trading. For instance, Reliance Industries shares reaching ₹2,700 in 2023 could mark their ATH if prices never previously crossed that level. This information is practical for timing entries or exits because price behaviours near ATH levels tend to show increased volatility and trading volume.
While 52-week highs or previous swing highs focus on limited time frames, ATH looks at the complete history of price movement. This makes ATH a more reliable indicator of extreme market conditions. Market participants often treat breaking an ATH as a confirmation of a long-term bullish trend, whereas failing to surpass past highs might raise caution about potential reversals.
Stocks commonly reach ATHs during periods of strong company performance or favourable economic conditions. For example, Nifty 50 hitting a new ATH signals broad market optimism, encouraging investors to add equity exposure. However, such peaks often prompt profit booking, making it a double-edged sword for traders.
Commodities like gold or crude oil also see ATHs influenced by supply-demand dynamics, geopolitical tensions, or inflation fears. When gold reaches ₹60,000 per 10 grams, its ATH could signal rising investor preference for safe havens amid market uncertainty. Traders monitor these levels to anticipate potential corrections or continuation.
Currencies seldom hit ATHs because they fluctuate continuously, but cryptocurrencies—like Bitcoin reaching $70,000—capture ATHs more visibly. These ATHs often lead to media buzz and influxes of retail investors, which might drive sharp, short-term price swings. Knowing ATH levels helps manage risks in such volatile markets.
Determining ATH involves reviewing historical price charts to find the highest recorded price. Traders and analysts use technical charting tools to identify these peaks clearly. For example, examining 10 years of data on the Bombay Stock Exchange (BSE) helps pinpoint longest-standing ATHs, useful for backtesting strategies.
Stock exchanges like NSE or BSE publish official price data, ensuring accuracy in identifying ATHs. Third-party financial platforms compile this data for easy access. Reliable data prevents errors in recognising ATHs, which is critical because wrong information can lead to poor trading choices.

Understanding the exact definition and types of ATH across assets empowers traders to make more informed decisions around these key price milestones.
It aids in distinguishing short-term peaks from historically significant highs
Helps interpret market enthusiasm or caution signals
Supports risk management by recognising potential reversal points
In summary, grasping what ATH means, the variety of instruments it applies to, and how it’s determined lays a solid foundation for utilising this concept effectively in trading strategies.
Understanding why all-time highs (ATH) matter gives traders and investors an edge in decision-making. ATH levels act like psychological markers where market sentiment shifts, affecting behaviour and strategies. Knowing this helps you gauge when to take profit, hold on, or stay cautious.
Confidence versus caution near ATH levels
When an asset hits its ATH, it often sparks confidence among traders, signalling strong demand and possibly continued price gains. For example, when Reliance Industries touched new highs during rallies, many investors bought in expecting further momentum. However, this confidence can flip to caution quickly, as prices near ATH often face resistance. Smart traders watch for subtle signs of slowdown or divergence in indicators to avoid getting trapped in late-stage rallies.
Fear of missing out (FOMO) effects
FOMO frequently kicks in when prices break previous highs. This emotional response pushes reluctant investors to jump in, worried they might miss profits. During the recent surge in shares like Tata Motors, FOMO driven buying accelerated price rises sharply. While FOMO can fuel momentum, it also risks inflating prices beyond fundamentals, leading to quick corrections. Traders must balance the pressure to act with disciplined analysis to avoid costly mistakes.
Confirming bullish trends
An ATH often confirms a strong bullish trend as it indicates demand outstrips supply at previous peaks. For instance, the Nifty 50 breaking to new highs generally draws in more buyers, confirming positive market sentiment. Traders often look to enter or add to positions during such breakouts, expecting the uptrend to continue. Volume confirmation alongside price moving to ATH gives added assurance of sustained momentum.
Potential for trend reversals after ATH
Though ATH points to strength, it can also precede trend reversals. Sometimes prices struggle to push beyond the high, showing exhaustion. For example, stocks like YES Bank faced sharp reversals after hitting peaks amid negative news. Recognising early warning signs such as weakening volume or bearish patterns helps traders cut losses. Being alert around ATH levels prevents being caught in sudden downturns.
Increased trading activity at ATH
Trading volumes typically surge near ATH as more participants enter the market, chasing momentum or booking profits. This was visible during the Infosys rally in early 2023 when volumes spiked near new highs. Higher volumes enhance liquidity, which generally helps with smoother order execution but also signals intensified market interest.
Volatility spikes and their implications
Volatility often spikes at ATH due to uncertainty between bulls and bears battling over price direction. Sharp price swings can result from profit booking, FOMO-buying, or market news impacting sentiment. For example, volatility rose noticeably in the Nifty following quick gains above ATH. Traders should prepare for wider price ranges and set stop-loss orders accordingly to manage risk during these periods.
Market behaviour around all-time highs reflects a dynamic tussle between optimism and caution. Recognising these patterns equips you to navigate opportunities and avoid pitfalls efficiently.
Trading near All-Time Highs (ATH) calls for well-planned strategies to manage both the opportunities and risks. Prices hitting ATH typically indicate strong bullish momentum, but this phase can quickly reverse or show volatility. Hence, traders and investors who develop robust approaches around these levels improve their chances of securing profits while limiting potential losses. The following sections explain practical tactics widely used when dealing with ATH scenarios.
Identifying confirmed breakouts above ATH is vital for breakout traders. A mere touch of ATH doesn't always mean fresh strength; confirmation usually comes with volume spikes and sustained price closing above the ATH level. For example, a stock like Reliance Industries breaking past its previous ATH accompanied by high trading volume signals that buyers are serious, not just speculators pushing price momentarily. This confirmation helps traders avoid false breakouts that can lead to losses.
When it comes to entry and stop-loss placement, timing and risk control are key. Traders often enter positions once price closes above ATH on strong volume and momentum. It's smart to place stop-loss just below the ATH level or a recent minor support to protect capital if the breakout fails. Taking Tata Motors, for instance, if it breaks its ATH at ₹400 with volume support, you might enter near ₹402, but set a stop-loss around ₹395 to cap downside risk.
Scaling out of positions means gradually selling parts of your holdings as price extends beyond ATH. This limits risk by locking in gains rather than riding the entire move, which could abruptly reverse. For example, an investor holding Infosys shares could sell 30% near the ATH, keep some for further uptrend, and exit more if the trend falters, balancing profit and risk nicely.
Adjusting stop-losses to protect gains is equally important around ATH levels. As price moves higher, trailing stop-loss orders help safeguard profits by moving the stop upward to just below recent lows or moving averages. This is especially useful during volatile phases near ATH where sudden corrections can happen. A trader in HDFC Bank shares might move their stop-loss from ₹1,400 to ₹1,450 as price climbs from ₹1,480 to ₹1,550, locking profit while allowing upwards room.
The Relative Strength Index (RSI) is a key tool to spot overbought conditions when approaching or breaking ATH. RSI values above 70 typically suggest the asset is overbought, which may warn of a near-term pullback or consolidation. However, during strong trends, RSI can stay high for some time. For instance, during TCS's ATH rally, RSI remained above 70 but sideways price action soon followed, advising caution rather than immediate exit.
Moving averages act as dynamic support or resistance near ATHs. The 50-day or 200-day moving average often offers a reference level where price may bounce or face hurdles. If an index like Nifty 50 hits ATH but closes near its 50-day moving average support, it signals trend strength. Conversely, falling below such moving averages suggests weakening momentum, highlighting the need for alertness in trading decisions.
Combining breakout strategies with disciplined profit booking and technical indicators provides a balanced way to trade near ATH, increasing chances of success while managing inherent risks effectively.
Trading at all-time highs (ATH) carries significant risks that every trader and investor must recognise. While ATHs can signal strong market performance, the possibility of sudden price corrections, overvaluation, and behavioural biases makes it necessary to approach such levels cautiously. Understanding these challenges can help you make informed decisions and protect your capital.
Identifying warning signs is crucial when markets reach ATH. Sharp price increases often attract speculative buyers, creating a fragile environment. Watch for increasing volatility, divergence in technical indicators like RSI showing overbought conditions, or decreasing volume on upward moves. These clues suggest the rally may be losing steam and a correction could follow. For example, rising volume but falling prices could mean sellers are slowly taking control.
Historical examples of sharp reversals help in grasping the impact of sudden market falls after ATHs. The 2020 stock market crash in March, after initial highs, showed how factors like pandemics can trigger reversals despite strong prior gains. Similarly, India’s IT sector witnessed corrections in 2018 when valuations ran ahead of earnings growth, causing sharp pullbacks. These episodes reinforce the need for vigilance near ATHs.
Valuation metrics to watch include price-to-earnings (P/E) ratios, price-to-book (P/B), and price-to-sales (P/S) ratios. When these exceed historical averages significantly, the market or stock may be overvalued. For instance, many high-flying tech stocks often trade at inflated P/E multiples during ATH phases, raising the risk of a market reset. Keeping an eye on these numbers prevents chasing expensive assets blindly.
Impact on long-term investment decisions is significant because overvalued assets can drag down portfolio returns over time. Investors buying at ATH might see lower future gains if prices normalise. A cautious approach involves assessing the intrinsic value relative to market price before investing heavily. Diversifying across sectors avoids overexposure to overvalued stocks.
Resisting impulsive decisions near ATH is tough but necessary. The fear of missing out (FOMO) can push traders to enter at peaks, often without proper analysis. Sticking to your trading plan and using limit orders for entries helps prevent rash choices. Experienced traders remind themselves that not every rally is sustainable.
Maintaining discipline in volatile markets is essential for long-term success. Markets near ATH tend to swing widely, tempting emotional trading. Setting predefined stop-loss levels and taking profits gradually helps maintain control. Remember, patience and systematic risk management often outperform impulsive trades during these times.
Trading at all-time highs demands a careful balance between seizing opportunities and guarding against risks. Recognising signs of reversals, valuation traps, and psychological pitfalls can protect your interests effectively.
Tracking all-time high (ATH) data in Indian markets provides traders and investors with valuable insights into market momentum and potential turning points. Especially in a market like India’s, where sectors can be volatile and influenced by policy shifts, monitoring ATH helps in timely decision-making for portfolio adjustments and risk control.
The National Stock Exchange (NSE) and Bombay Stock Exchange (BSE) offer official, real-time data on stock prices and indices. Their platforms list accurate historical price records, making it straightforward to identify when stocks or indices hit new ATHs. For example, when the Nifty 50 or Sensex crosses past previous peaks, these exchanges provide clear data points backed by reliable trade volumes and price confirmation.
Using these official platforms directly reduces reliance on third-party data which may lag or contain inaccuracies. Investors can also access detailed market depth, sector-wise performance, and corporate announcements that often influence ATH formations.
Aside from exchanges, financial news outlets like Moneycontrol, Economic Times Markets, and brokerages such as Zerodha and Upstox provide convenient ATH tracking tools integrated with market news and analysis. These platforms often highlight recent ATH hits alongside expert commentary, making it easier for investors to interpret the implications.
Brokerage platforms also allow setting alerts for ATHs on watchlists, helping active traders react swiftly to breakout or reversal signals. Combining news insights with price data from these portals can provide a sharp edge in volatile scenarios.
Stocks reaching ATH levels frequently signal sustained growth momentum backed by strong fundamentals or positive market sentiment. For instance, tech companies like Infosys or HCL Technologies often hit ATHs during earnings season when they post robust quarterly results.
Investors can spot such growth by analysing ATH trends in sectors like IT, pharmaceuticals, or consumer goods. Monitoring ATH helps in identifying industry outperformers worth considering for portfolio addition or increased exposure.
Conversely, ATH alerts serve as caution signals in volatile segments like metals or banking, where prices can quickly retrace. For example, if a commodity stock hits ATH without supporting volume or sector strength, it might indicate an overheated rally ripe for correction.
Using ATH as a risk management tool means setting stop-losses or trimming positions before a market cools down, protecting portfolios from sudden downturns common in Indian markets during monsoon or budget announcements.
The Securities and Exchange Board of India (SEBI) enforces regulations that indirectly influence ATH occurrences. SEBI’s surveillance against market manipulation and insider trading helps maintain genuine price discovery, especially when securities reach new highs.
Additionally, SEBI’s disclosure norms ensure companies announce material information timely, preventing shock reactions at ATH and enabling investors to react on facts rather than rumours.
Macroeconomic conditions like interest rate changes by the Reserve Bank of India (RBI), inflation trends, fiscal deficit data, and global market influences significantly impact ATH formations in Indian equities.
For instance, a cut in the repo rate often fuels buying interest pushing indices to ATHs, whereas rising crude prices may limit gains due to inflation fears. Investors must watch these factors closely, as they shape market tides just as much as company-specific events.
Keeping an eye on ATH data with the backdrop of India’s regulatory framework and economic climate helps investors make informed, timely decisions and manage risk effectively in dynamic market conditions.
📈 Learn what ATH (All-Time High) means in trading, how it shapes market trends, and smart strategies Indian investors can use to manage risks and spot opportunities wisely.
Explore Exness copy trading 📈 to learn how it works, benefits, and risks. Get practical steps tailored for Indian traders to start confidently on this platform.

📊 Explore QX trading: key features, platforms, risks & benefits explained. Understand its role in financial markets for smarter investing decisions in India.
Explore demo trading websites to practise strategies risk-free 📈. Learn key features, top platforms & drawbacks to boost your trading skills in India 🇮🇳.
Based on 14 reviews